Practical – smart home insights with AWS IoT Analytics – Working with Data and Analytics-1
In this practical exercise, we will explore IoT data analytics using AWS. Specifically, we will use AWS services such as S3, Glue, Athena, and QuickSight to analyze a dataset of IoT sensor readings collected from a smart home over a period of 1 month.
You will need the following software components as part of the practical:
An AWS account (you can create one for free if you don’t have one already) A dataset of IoT sensor readings (you can create a sample dataset or use a publicly available dataset)
Let’s move to the various steps of the practical, as follows:
Download the occupancy detection dataset:
- We can obtain a dataset from https://github.com/PacktPublishing/IoT-Made-Easy-for-Beginners/tree/main/Chapter10/analyzing_smart_home_sensor_readings/datatest.csv.
- Open the dataset and take note of the fields inside it.
To start off, we will have to load our dataset into an Amazon S3 bucket:
- Sign in to your AWS Management Console.
- Navigate to the Amazon S3 service.
- Click on the Create bucket button. Name the bucket and choose a region. Click Next.
- Keep all the default settings in the Configure options page and click Next.
- Ensure public access is blocked for security reasons and click Next.
- Review your settings and click Create bucket.
- Navigate inside your newly created bucket, click on Upload, and drag and drop (or browse to) your datatest.csv file. Once uploaded, click Next.
- Keep the default permissions and click Next.
- Review the properties and click Upload.
We now will look to create an AWS Glue crawler to traverse our data and create a table in the AWS Glue Data Catalog:
- Navigate to the AWS Glue service.
- Click on the Crawlers tab under Data Catalog and then click Create crawler.
- Name your crawler and click Next.
- Select Not yet for the question Is your data already mapped to Glue tables.
- Click on Add a data source and choose S3 as the data source. Click Browse S3 and select the bucket you have just created. Click Next.
- Choose or create an Identity and Access Management (IAM) role that gives AWS Glue permissions to access your S3 data. Click Next.
- For the frequency, you can choose Run on demand. Click Next.
- Choose Add database, then name your database (for example, SmartHomeData). Navigate to your newly created database and click on Add table. Name your table (for example, SensorReadings) and select your database. Leave all other settings as they are. Click Next in the current window along with the subsequent ones, up to the window where you click Create to create the table.
- Review the configuration and click Create crawler.
With that, we have created an AWS Glue crawler to traverse our data. Now, we can look at transforming our data:
Use AWS Glue to transform the data and create a new table with additional columns:
- Navigate to ETL Jobs in the AWS Glue sidebar.
- Select Visual with a blank canvas and click on Create.
- Name your job on the top left and select or create an IAM role that has the right permissions.
- An Add nodes window should pop up. In the Sources tab, click on Amazon S3 to add an Amazon S3 node. Afterward, click on the Transforms tab and click on the Select Fields node. Finally, click on Target and click on Amazon S3.
- You should now have three nodes on your canvas. Connect the data source to the Transform – SelectFields node by dragging the black dot at the bottom of the Data source – S3 bucket node to the Select Fields node. Do the same to connect the Select Fields node to the Data target – S3 bucket node:
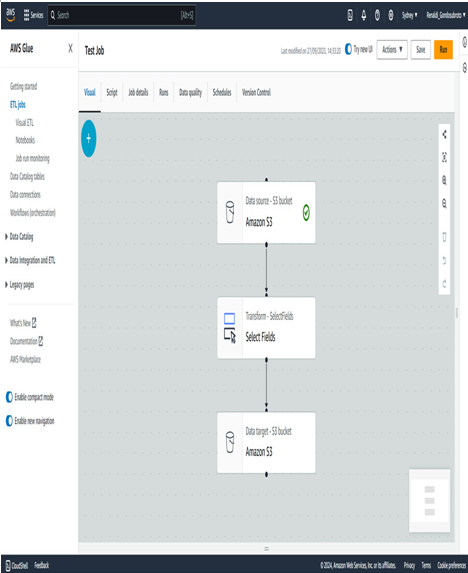
Figure 10.2 – Visualization of the three nodes on the canvas
Click on the Data Source – S3 bucket node. For the S3 source type, click on the Data Catalog table. Afterward, choose the database that you created. Choose the table that was created.
Afterward, click on Select Fields. Here, choose the field’s temperature and humidity.
We now need to create another S3 bucket for the output. Create a new S3 bucket with whatever name you want for it.