Category Continuous operation of IoT systems

Application layer attacks – Examining Security and Privacy in IoT

Application layer attacks target the software and services that run on IoT devices or the cloud services that manage them. Attackers could exploit vulnerabilities in the software or firmware running on the device to gain control over it or access sensitive data. Attackers could also launch attacks such as SQL injection or cross-site scripting (XSS) attacks on the web applications used to manage the devices.

IoT networks face a wide range of attacks, and each layer of the network presents different vulnerabilities. IoT security must be implemented at each layer of the network to mitigate the risks associated with these attacks. The use of encryption, authentication, and access controls can help to secure physical devices and the data transmitted between them. Regular updates and patches should be applied to the software and firmware running on the devices to address any known vulnerabilities. Overall, a layered security approach that considers the entire IoT ecosystem can provide a more robust defense against attacks.

We can see different forms of attacks on embedded IoT systems in Figure 11.2:

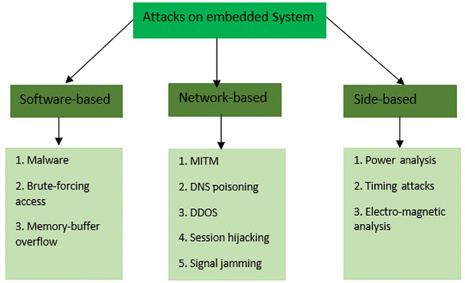
Figure 11.2 – Different attacks on embedded systems

The diagram provides a structured view of potential vulnerabilities an embedded system may face, categorizing them based on the method or perspective of the attack. It categorizes the different attacks into three main types: Software-based, Network-based, and Side-based, described as follows:

Software-based attacks:

  • Malware: Malicious software intended to damage or exploit an embedded system
  • Brute-forcing access: A method of trial and error whereby an attacker attempts to guess the correct access credentials
  • Memory-buffer overflow: A situation where a program writes data outside the bounds of pre-allocated fixed-length buffers, leading to potential code execution or system crashes

Network-based attacks:

  • MITM: An attack where the attacker secretly relays and possibly alters the communication between two parties who believe they are communicating directly with each other
  • Domain Name System (DNS) poisoning: An attack where the attacker redirects DNS entries to a malicious site
  • DDOS: An attempt to disrupt the regular functioning of a network by flooding it with excessive traffic
  • Session hijacking: When an attacker takes over a user’s session to gain unauthorized access to a system
  • Signal jamming: An interference with the signal frequencies that an embedded system might use, rendering it inoperable or reducing its efficiency

Side-based attacks:

  • Power analysis: Observing the power consumption of a device to extract information
  • Timing attacks: Analyzing the time taken to execute cryptographic algorithms to find vulnerabilities
  • Electromagnetic analysis: Using the electromagnetic emissions of a device to infer data or operations

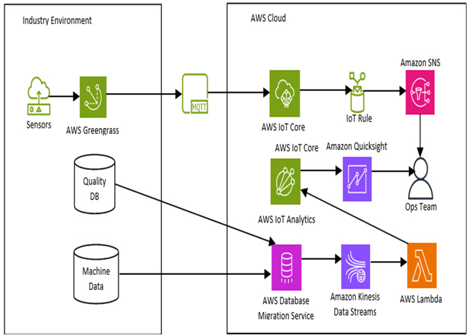
With that understanding, we can now look at how cloud providers such as Amazon Web Services (AWS) provide powerful tools to manage security on the platform.

Security and privacy controls within the cloud management landscape – Examining Security and Privacy in IoT

As more and more IoT devices are connected to the internet, cloud management has become an essential component of IoT networks. The cloud provides a scalable, flexible, and cost-effective solution for storing and processing the vast amounts of data generated by IoT devices. However, with the benefits of the cloud also come security and privacy concerns.

This section will discuss security and privacy controls that are necessary within the cloud management landscape to ensure the safe and effective operation of IoT networks. We will explore key security and privacy considerations in the cloud, including data encryption, identity and access management (IAM), network security, and compliance with regulatory requirements.

Types of attacks

IoT networks face numerous threats that come from various sources. Attackers could target physical devices, communication channels, or the cloud services that manage the devices. Each layer of the IoT network presents a different vulnerability, and attackers have different techniques for exploiting each layer.

Physical layer attacks

Physical attacks on IoT devices involve gaining access to the devices through direct manipulation. Attackers could physically connect to the device’s ports, such as USB or Ethernet ports, and install malicious firmware or software to take control of the device. Attackers could also use side-channel attacks to obtain sensitive information from the device’s hardware or firmware, such as encryption keys or other authentication data.

Data link layer attacks

Data link layer (DLL) attacks involve intercepting or manipulating communication between IoT devices and the network. Attackers could use techniques such as packet sniffing or man-in-the-middle (MitM) attacks to capture and modify data being transmitted between devices. Attackers could also use spoofing attacks to impersonate legitimate devices or gateways to gain access to the network.

Network layer attacks

Network layer attacks focus on disrupting the network infrastructure that connects IoT devices. Attackers could launch DDoS attacks to overload the network with traffic, causing it to become unresponsive. Attackers could also exploit vulnerabilities in the routing protocols used by IoT networks to redirect or manipulate data traffic.

Creating a channel – Working with Data and Analytics

Let’s create our channel as part of the analytics workflow:

If you have not already, sign in to the AWS console. Afterward, navigate to the IoT Analytics console. For your convenience, here is a link to the console: https://console.aws.amazon.com/iotanalytics/.

In the IoT Analytics dashboard, click on Channels on the sidebar and click the Create channel button.

Provide a name for the channel (for example, mychannel) and follow through with the default settings. For the storage type, pick Service managed storage. Click on Create at the bottom to finish creating the channel.

You can view the created channel by navigating to the Channels section from the sidebar:

Figure 10.6 – Channel created in the IoT Analytics list of channels

With the channel created, we can now create a data store.

Creating a data store

Creating a data store is necessary to store data that has been put through the pipeline. We will walk through its creation here:

We can add multiple data stores, but for the purposes of this exercise, we will use a single data store. In the IoT Analytics dashboard, click on Data stores on the sidebar and click the Create data store button.

Choose Service managed storage as the storage type:

Figure 10.7 – Configuring the storage type used for the data store

Click Create to finalize the data store creation.

To view created data stores, go to the Datastore section from the sidebar.

With the data store created, we can now create a pipeline.

Creating a pipeline

A pipeline consumes messages that come from a channel and allows you to process and filter them before storing them within the data store. Here are the steps to create a pipeline:

In the IoT Analytics dashboard, click on Pipelines on the sidebar and click the Create pipeline button. It should then take you to the following screen:

Figure 10.8 – Configuring the pipeline ID and sources for the pipeline

Provide a name for the pipeline (for example, mypipeline) and follow through with the default settings. For Pipeline source, pick your newly created channel, and for Pipeline output, pick your newly created data source.

For Enrich, transform, and filter messages, pick Select attributes from the message.

Click on Create at the bottom to finish creating the channel.

As with previous steps, we can then check whether the pipeline was created successfully by viewing it on the Pipelines page of the IoT Analytics dashboard.

Having created a pipeline, we can now start ingesting some data through it.

A case study for data analytics – Working with Data and Analytics

Now that we have seen use cases and have learned about how we can evaluate IoT deployments that leverage data analytics services on AWS, let’s take a look at how one industrial environment can utilize the AWS environment to perform data analytics workloads and the workflow behind it. We can see this case represented in Figure 10.4:

Figure 10.4 – AWS data analysis within an industrial environment

In this workflow, we can see that the industrial environment is pushing data onto AWS Greengrass, which in turn uses the IoT MQTT protocol to deliver data to AWS IoT Core. It will then in turn put through data to AWS IoT Analytics to be further visualized via QuickSight. On the other hand, if an IoT rule is triggered, it will instead feed the data to Amazon SNS, where the operations team will be notified through an alert. Additionally, data can also be fed in by moving the on-premises database onto the cloud with Database Migration Service (DMS), which is a service used for migrating databases onto AWS. It can then be ingested using Amazon Kinesis Data Streams and processed using AWS Lambda, where it then will be fed into AWS IoT Analytics.

Now that we’ve become more familiar with these workflows for data analytics, let’s get on to our practical.

Practical – creating a data pipeline for end-to-end data ingestion and analysis

In this practical, we will look to create a data pipeline based on the AWS console. This will follow the architecture shown in the following diagram:

Figure 10.5 – Data pipeline workflow for data ingestion

We will have a device send data to a channel. The channel will receive the data and send it through the pipeline, which will pipe the data through to the data store. From the data store, we can then make SQL queries to create a dataset from which we will read the data.

We can now go ahead and start off by creating a channel.

Industrial data analytics – Working with Data and Analytics

We have seen the usage of data analytics in the past two sections and how it can be beneficial for our workloads. Now, let’s look at how it can benefit industry cases and how we can accordingly evaluate our deployments based on the best practices that are set out for us.

Evaluating performance

Use services such as CloudWatch metrics to monitor the performance of the IoT Analytics pipeline, such as the number of messages processed, the time it takes to process each message, and the number of errors that are encountered. This will be critical for use in further analysis and eventual optimization. The following are factors to consider in evaluating performance:

Analyze your data: We can use IoT Analytics SQL or other data analytics tools to identify any patterns or issues that we may need to address if they affect system performance.

Optimize your pipeline: From the analysis of the data, we can optimize the pipeline by adding data normalization, validation, and modeling to improve the performance of the data analytics workloads.

Use best practices: We need to adhere to best practices for data analysis, which includes techniques such as normalization, data validation, and data modeling. For the scope of this book, we will not be covering this, but we encourage you to look up more of these techniques in the Further reading section and read up on the topics listed there.

Usage of third-party monitoring tools: We can utilize third-party monitoring tools to collect and analyze performance metrics for our analytics workload and gain more insights into how our pipeline is performing.

Monitor and track usage of resources: We need to keep an eye on resources such as CPU, memory, and storage that are used by our data analytics workloads, especially if they are consuming more resources than expected. If necessary, we should perform actions such as scaling our workloads up or optimizing the pipelines further.

Having understood how to keep track of performance, we can now review some different use cases of data analysis within industry.

Use cases within industry

Industry has many different use cases for performing data analysis on a myriad of data. Here are just a few prominent examples:

Predictive maintenance: Within this use case, IoT devices are used to collect real-time sensor data that is processed and analyzed using AWS IoT Analytics to detect patterns and accordingly predict when maintenance would be required. This will help organizations schedule maintenance at the required times, reducing downtime and improving the efficiency of equipment.

Smart agriculture: IoT sensors can be used to collect data on soil moisture and temperature, which is then analyzed within AWS IoT Analytics to optimize crop yields, reduce consumption of water, and improve overall farm efficiency.

Smart cities: IoT devices can be used to collect data on various aspects of urban infrastructure such as traffic, air quality, and energy usage. The data can then be analyzed through AWS IoT Analytics where it can then be used to improve traffic flow, reduce pollution, and optimize energy usage to ensure that cities become more sustainable and livable for their residents.

With those use cases in mind, we can now take a look at a case study of a data analytics flow used within a production environment in an industrial setting.

Practical – smart home insights with AWS IoT Analytics – Working with Data and Analytics-2

Click on the target S3 bucket on the canvas and select the format as Parquet. Specify the new Amazon S3 bucket you created (for example, s3://your_bucket_name).

Go to the Job details tab and specify the IAM role you have been using so far. Leave everything else as it is. Rename the script filename to anything you want, as long as it ends with .py (for example, test.py):

Figure 10.3 – Configuring job details for the Glue job

Click Save, and afterward, click Run.

With that, we have appropriately transformed the data as needed.

Use Amazon Athena to query the transformed data.

We can now look at leveraging Amazon Athena to query the data that we have transformed:

  1. Navigate to the Amazon Athena service.
  2. On the sidebar, click on Query editor.
  3. There should be a prompt asking you to select an output location for your queries. Specify an S3 bucket or a folder within a bucket to do so.
  4. In the Athena dashboard, select AWSDataCatalog as the data source and SmartHomeData database (or your predefined values for them).
  5. Run the following query by clicking Run:


Select * from mychannelbucket
6. You should get the full table that you created before. Now, use SQL queries to answer the following questions:

  1. What is the average temperature, humidity, and light intensity for each day of the month?
  2. What is the average temperature, humidity, and light intensity for each hour of the day?
  3. What is the average temperature, humidity, and light intensity for each day of the week?
  4. What is the correlation between temperature and humidity and between temperature and light intensity?
  1. View the query results and save the query results to a new S3 bucket.
    In this practical exercise, we explored IoT data analytics using AWS services such as S3, Glue, and Athena. We loaded a dataset of IoT sensor readings into an S3 bucket, used Glue to transform the data and create a new table with additional columns, used Athena to query the transformed data and generate insights, and used QuickSight to visualize the insights and create a dashboard. Based on the insights generated, we provided recommendations for improving the smart home experience.
    We will now move on to industrial data analytics.

Practical – smart home insights with AWS IoT Analytics – Working with Data and Analytics-1

In this practical exercise, we will explore IoT data analytics using AWS. Specifically, we will use AWS services such as S3, Glue, Athena, and QuickSight to analyze a dataset of IoT sensor readings collected from a smart home over a period of 1 month.

You will need the following software components as part of the practical:

An AWS account (you can create one for free if you don’t have one already) A dataset of IoT sensor readings (you can create a sample dataset or use a publicly available dataset)

Let’s move to the various steps of the practical, as follows:

Download the occupancy detection dataset:

  1. We can obtain a dataset from https://github.com/PacktPublishing/IoT-Made-Easy-for-Beginners/tree/main/Chapter10/analyzing_smart_home_sensor_readings/datatest.csv.
  2. Open the dataset and take note of the fields inside it.

To start off, we will have to load our dataset into an Amazon S3 bucket:

  1. Sign in to your AWS Management Console.
  2. Navigate to the Amazon S3 service.
  3. Click on the Create bucket button. Name the bucket and choose a region. Click Next.
  4. Keep all the default settings in the Configure options page and click Next.
  5. Ensure public access is blocked for security reasons and click Next.
  6. Review your settings and click Create bucket.
  7. Navigate inside your newly created bucket, click on Upload, and drag and drop (or browse to) your datatest.csv file. Once uploaded, click Next.
  8. Keep the default permissions and click Next.
  9. Review the properties and click Upload.

We now will look to create an AWS Glue crawler to traverse our data and create a table in the AWS Glue Data Catalog:

  1. Navigate to the AWS Glue service.
  2. Click on the Crawlers tab under Data Catalog and then click Create crawler.
  3. Name your crawler and click Next.
  4. Select Not yet for the question Is your data already mapped to Glue tables.
  5. Click on Add a data source and choose S3 as the data source. Click Browse S3 and select the bucket you have just created. Click Next.
  6. Choose or create an Identity and Access Management (IAM) role that gives AWS Glue permissions to access your S3 data. Click Next.
  7. For the frequency, you can choose Run on demand. Click Next.
  8. Choose Add database, then name your database (for example, SmartHomeData). Navigate to your newly created database and click on Add table. Name your table (for example, SensorReadings) and select your database. Leave all other settings as they are. Click Next in the current window along with the subsequent ones, up to the window where you click Create to create the table.
  9. Review the configuration and click Create crawler.

With that, we have created an AWS Glue crawler to traverse our data. Now, we can look at transforming our data:

Use AWS Glue to transform the data and create a new table with additional columns:

  1. Navigate to ETL Jobs in the AWS Glue sidebar.
  2. Select Visual with a blank canvas and click on Create.
  3. Name your job on the top left and select or create an IAM role that has the right permissions.
  4. An Add nodes window should pop up. In the Sources tab, click on Amazon S3 to add an Amazon S3 node. Afterward, click on the Transforms tab and click on the Select Fields node. Finally, click on Target and click on Amazon S3.
  5. You should now have three nodes on your canvas. Connect the data source to the Transform – SelectFields node by dragging the black dot at the bottom of the Data source – S3 bucket node to the Select Fields node. Do the same to connect the Select Fields node to the Data target – S3 bucket node:

Figure 10.2 – Visualization of the three nodes on the canvas

Click on the Data Source – S3 bucket node. For the S3 source type, click on the Data Catalog table. Afterward, choose the database that you created. Choose the table that was created.

Afterward, click on Select Fields. Here, choose the field’s temperature and humidity.

We now need to create another S3 bucket for the output. Create a new S3 bucket with whatever name you want for it.

Prometheus – Working with Data and Analytics

Prometheus is an open source monitoring and alerting system that is designed for data collection and analysis. It is appropriate to be used for monitoring and analyzing large numbers of servers alongside other types of infrastructure. It is based on a pull-based model, which means that it will periodically scrape metrics from predefined endpoints. This allows for data collection to be done accurately and efficiently and provides the ability to scale horizontally to accommodate a large number of servers.

Its data model is based on the concept of metrics and labels, allowing for powerful querying and aggregation of data. It also includes a built-in alerting system, allowing alerts to be created based on queries that are made on it. This allows for notifications to be made automatically. It can also be used in conjunction with other data visualization tools such as Grafana to create interactive dashboards that can provide real-time insights into the performance of systems and infrastructure. This is especially useful in the context of IoT deployments, where it is critical to identify and troubleshoot issues.

Designing AWS flow diagrams with data analysis

It is important to understand the steps that have to be taken to design data analysis workloads before going forward with the implementation. The following is a seven-step process for designing these data analysis workloads:

Identify your data sources: You will need to start by identifying the data sources that you will need to collect and analyze. This may include data from your IoT devices, sensor data, log files, and other data sources that may be relevant.

Determine your data storage needs: Decide on what type of data storage you will need to store the data that you have collected from your IoT devices. Services such as S3, DynamoDB, and Kinesis Data Streams can be used for this purpose.

Design a data processing pipeline: Determine how your data will be processed, cleaned, and transformed. You can utilize services such as AWS Data Pipeline or AWS Lambda for this.

Choose the data analysis and visualization tools that you will need: Select appropriate data analysis and visualization tools that best fit your use case. You can use tools such as Amazon QuickSight, AWS IoT Analytics, and Amazon ElasticSearch.

Create a data security and compliance plan: You will then need to design a security and compliance plan to protect your data and ensure that you adhere to relevant regulatory requirements. This may include steps such as data encryption and access controls.

Test and optimize your deployment: You will then need to test the design by running a small pilot and optimizing it accordingly based on the results that you receive. You must then continuously monitor the performance and make any necessary adjustments accordingly.

Deploy and maintain: Finally, you will need to deploy the design within a production environment, ensuring that you continuously monitor and maintain it to prevent any errors and ensure it runs smoothly. This is why monitoring tools such as Amazon CloudWatch are imperative for this use case, as errors in our environment can happen anytime, and we want to be ready to make any adjustments autonomously when possible.

It is important to note that this is not an exhaustive list; there can certainly be more steps based on each user’s use case. However, this already encompasses most data workloads and certainly provides a guideline for how you choose to design your own flows moving forward.

Next, we will look at a practical exercise where we will create and design a data pipeline for for end-to-end data ingestion and analysis, based on the components of AWS IoT Analytics.

Amazon QuickSight – Working with Data and Analytics

Amazon QuickSight is a business intelligence (BI) tool that allows you to easily create, analyze, and visualize data. You can connect to various data sources such as databases and cloud storage, and accordingly create interactive dashboards and reports to gain insights based on the data. This way, you can quickly identify patterns and trends and understand your data to make data-driven decisions. You can also integrate it with other AWS services such as IoT Analytics for more powerful data analysis.

Amazon S3

Amazon S3 is a cloud storage service that allows you to store and retrieve large amounts of data, including photos, files, videos, and more. You can integrate it with other AWS services to create powerful data management and analytics solutions, while also being affordable, providing you scalability as your data storage needs grow.

Amazon CloudWatch

Amazon CloudWatch is a service that allows you to monitor and manage your resources and applications that are based on AWS. You can collect and track metrics, monitor log files, and set alarms that trigger certain actions based on your resources to save you the time of manually doing so. You can also use it to monitor the health of your applications and receive notifications if there are any issues.

Amazon SNS

Amazon Simple Notification Service (SNS) is a messaging service that allows applications to send and receive messages and notifications, allowing a large number of recipients to send and receive messages with just a few clicks. It is widely used for sending notifications, updates, and alerts to users, customers, or other systems. These notifications can be directed to text, email, or other services that you have on AWS.

Now that we understand the various of different services that can be used as part of our data analysis workloads, let’s start looking at third-party services and create data workflows within the cloud that can utilize the services that we have discussed in this section.

Analysis on the cloud and outside

When working with data, it often is necessary to visualize data to gain insights and make informed decisions. With services such as Amazon QuickSight, you are able to do this and create interactive dashboards and reports. However, some organizations’ requirements may necessitate the use of third-party services alongside AWS’ native tools.

Many third-party services can be used. In this section, we will discuss some of these third-party services, alongside how we can start architecting workloads within the cloud for data workflows and quickly ensure that they adhere to best practices, both when creating and evaluating them.

Third-party data services

In this section, we will talk about two different third-party data analytics and visualization services: Datadog and Prometheus.

Datadog

Datadog is a cloud-based monitoring and analytics platform that provides many features for monitoring and troubleshooting many aspects of an organization’s IT infrastructure and applications. It allows for real-time data collection and monitoring from various sources, including servers, containers, and cloud services. Key features include cloud infrastructure monitoring, application performance monitoring, log management trace analysis, and its integration with many services such as AWS, Kubernetes, and Jira, allowing users to collect and analyze data within one location.

AWS IoT Analytics – Working with Data and Analytics

AWS IoT Analytics is a service that is used to collect, process, and analyze data that is obtained from IoT devices. You can process and analyze large datasets from IoT devices with the help of IoT Analytics without the need for complex infrastructure or programming. You can apply mathematical and statistical models to your data to make sense of it and make better decisions accordingly. You can also integrate it with many other services from AWS, such as Amazon S3 or Amazon QuickSight, to perform further analytical and visualization workloads.

The following are components of IoT Analytics that are crucial for you to know that we will be using as we go through our exercise within the next subsection:

Channel: A channel is used to collect data from a select Message Queuing Telemetry Transport (MQTT) topic and archive unprocessed messages before the data is published to the pipeline. You can either use this or send messages to the channel directly through the BatchPutMessage API. Messages that are unprocessed will be stored within an S3 bucket that will be managed either by you or AWS IoT Analytics.

Pipeline: Pipelines consume messages that come from a channel and allow you to process the messages before then storing them within a data store. The pipeline activities then perform the necessary transformations on the messages that you have, such as renaming, adding message attributes, or filtering messages based on attribute values.

Data store: Pipelines then store the processed messages within a data store, which is a repository of messages that can be queried. It is important to make the distinction between this and a database as it is not a database but is more like a temporary repository. Multiple data stores can be provisioned for messages that come from different devices or locations, or you can have them filtered by their message attributes depending on how you configure your pipeline along with its requirements. The data store’s processed messages will also be stored within an S3 bucket that can be managed either by you or AWS IoT Analytics.

Dataset: Data is retrieved from a data store and made into a dataset. IoT Analytics allows you to create a SQL dataset or a container dataset. You can further explore insights in your dataset through integration with Amazon QuickSight or Jupyter Notebook. Jupyter Notebook is an open source web application that allows you to create and share documents containing live code, equations, visualizations, and narrative text, and is often used for data cleaning and transformation, numerical simulation, statistical modeling, data visualization, and ML. You can also send the contents of a dataset to an S3 bucket, allowing you to then enable integration with existing data lakes or in-house applications that you may have to perform further analysis and visualization. You can also send the contents to AWS IoT Events to trigger certain actions if there are failures or changes in operation.

SQL dataset: An SQL dataset is like the view that would be had from a materialized view of an SQL database. You can create SQL datasets by applying an SQL action.

Trigger: A trigger is a component you can specify to create a dataset automatically. It can be a time interval or based on when the content of another dataset has been created.

With an understanding of these components, we can look at other services that we will also come across in our practical exercises.