Data analysis is often done at scale to analyze large sets of data using the capabilities of cloud computing services such as AWS. Designing a workflow for the data analysis to follow is the pivotal starting point for this to be performed. This will follow five main categories: collection, storage, processing, visualization, and data security.
In this section, we will be introducing you to data analysis on AWS, discussing which services we can use as part of AWS to perform the data analytics workloads we need it to, and walking through the best practices that are part of this. We will understand how to design and incorporate workflows into the IoT network that we currently have and work with it to better power our capabilities.
Data analysis on AWS
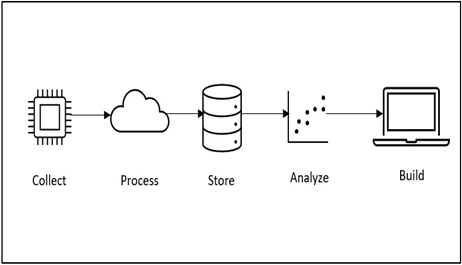
Data analysis on AWS can be summarized in five main steps. These steps can be seen in the following diagram:
Figure 10.1 – Data analysis workflow on AWS
Let’s look at the steps in more detail:
Collect: In this phase, data is collected from the devices within the environment. Services that are usually in charge of this include AWS IoT Core and AWS IoT Greengrass, which collects the data and ingests it into the cloud.
Process: Data can then be processed according to how the configuration is set up for it. Services such as AWS IoT Analytics are made for this purpose.
Store: Data can then be stored, either temporarily or for long-term storage. This can be done on services such as Amazon Simple Storage Service (S3), Amazon Redshift, and Amazon DocumentDB.
Analyze: Data will then be analyzed. Services such as AWS Glue and Amazon Elastic MapReduce (EMR) can be used for this purpose, while also potentially performing more complex analytics and ML tasks as necessary.
Build: We can then build datasets using this data, making patterns from the processed data that we have received from the workloads that are run.
With that, we have understood the different steps of how a typical data analysis workflow would go at a high level. Now, we can look at the different services in AWS that help facilitate this.
AWS services
Several important services can be used for data processing workloads. These five services are just a few of them, and there are definitely more that can be mentioned and that we encourage you to have a look at. For more information on this, you can refer to the documentation that is linked in the Further reading section at the end of the chapter.
In this exercise, we will walk through the process of creating an AWS IoT Greengrass group for edge computing. We will start by creating a new AWS IoT Greengrass group and configuring its core settings. Next, we will create a device definition and add it to the group, along with the Lambda functions and subscriptions needed for edge processing. Finally, we will deploy the AWS IoT Greengrass group to our local devices and verify that it is working as expected.
By the end of this exercise, you will have a solid understanding of how to set up an AWS IoT Greengrass group for edge computing and how to deploy it to your local devices. You will be able to leverage this knowledge to build powerful and scalable IoT applications that can process data locally and communicate with the cloud in a seamless and efficient manner.
Setting up your OpenAI account
To start off with the practical, we will need to set up our OpenAI account, which will allow us to then use ChatGPT. The following steps will guide you through doing this:
Sign up on OpenAI’s website:
Go to OpenAI’s website.
Click on the Sign Up or Get Started button.
Fill out your information including your name, email, and password.
Accept the terms and conditions and submit the form.
Confirm your email:
After you have signed up, OpenAI will send you a verification email.
Open the email and click on the verification link. This will verify your account and allow you to continue the process.
Click on your account on the top right and click on View API Keys.
You will find the API key creation page here. Click on Create new secret key, copy the API key, and save it for later.
Remember to keep your API key safe and do not share it with anyone. Treat it like a password, as anyone who has it can make API requests under your account and you will be charged for them.
Finally, always make sure that the way you’re using OpenAI’s API follows its usage policies. If it determines that your usage is not in compliance, it may disable your API key.
Spinning up an Amazon EC2 instance
Now, we will need to create an EC2 instance to act as the intermediary of where we are going to call the ChatGPT API from:
Log in to the AWS Management Console: Access the AWS Management Console at https://aws.amazon.com/console/ and sign in with your AWS account.
Go to the Amazon EC2 dashboard: Click on Services at the top of the page and search for EC2 under Compute to go to the Amazon EC2 dashboard.
Create a new instance: Click on the Instances link in the left-side menu. Then click the Launch Instance button.
Choose an Amazon Machine Image (AMI): You will see a list of available AMIs. Select the Amazon Linux 2 AMI (HVM) option. This is a general-purpose Linux instance that is maintained by AWS.
Choose an instance type: On the next page, select an instance type that fits your requirements. For this practical, you can start with a small instance type, such as t2.micro, which is eligible for the free tier. Click Next: Configure Instance Details.
Configure instance details: You can leave most options at their default settings. However, be sure to select the appropriate VPC and subnet, if necessary. Enable Auto-assign Public IP if you want AWS to assign a public IP address to your instance for remote access.
Add storage: Click Next: Add Storage. By default, Amazon Linux instances come with 8 GB of root volume. You can adjust this according to your needs.
Add tags: Click Next: Add Tags. You can assign key-value pairs as tags to your instance. This is optional but can help you manage your AWS resources.
Configure security group: Click Next: Configure Security Group. You can create a new security group or assign an existing one. At a minimum, you should allow SSH access (port 22) from your IP address for remote management of your instance.
Review and launch: Click Next: Review and Launch. Review your instance configuration. If everything is satisfactory, click Launch.
Key pair: A pop-up window will ask you to select an existing key pair or create a new one. This key pair is used to SSH into your instance. If you create a new one, be sure to download it and keep it secure.
Launch instance: Click Launch Instance after selecting your key pair. Your instance will now be launched.
Now you can SSH into your instance by clicking on the instance ID at the top of the page and clicking Connect. Navigate to the EC2 Instance Connect pane, choose Connect Using EC2 Instance Connect, and click on Connect.
With that, we have spun up the EC2 instance we need and connected to it. Now, we are ready to configure AWS Greengrass on it to simulate our IoT thing.
These KPIs measure the overall performance and health of the IoT network and include network latency, packet loss, and throughput. By monitoring these KPIs, organizations can identify potential network bottlenecks and take corrective actions to ensure smooth network operation.
User-level KPIs
These KPIs measure the user experience of IoT applications and services and include response time and availability. By monitoring these KPIs, organizations can ensure that end users are satisfied with the performance of IoT applications and services.
Security KPIs
These KPIs measure the effectiveness of security controls in place to protect IoT devices and data and include the number of security incidents, the severity of incidents, and the time to resolution. By monitoring these KPIs, organizations can identify potential security threats and take corrective actions to prevent them.
Business-level KPIs
These KPIs measure the business impact of the IoT network and include revenue generated, cost savings, and customer satisfaction. By monitoring these KPIs, organizations can understand the overall value of their IoT networks and identify opportunities for improvement.
Selecting, analyzing, and monitoring KPIs
Selecting, analyzing, and monitoring KPIs is an essential step in implementing an effective continuous monitoring strategy for IoT networks. Here are some steps to follow to ensure that KPIs are selected, analyzed, and monitored effectively:
Identify your objectives: Before selecting KPIs, it is important to identify your monitoring objectives. This involves understanding what you want to achieve with your monitoring program and what metrics will help you track progress toward those objectives.
Choose relevant KPIs: Once you have identified your objectives, choose KPIs that are relevant to your objectives. Ensure that the KPIs are specific, measurable, achievable, relevant, and time-bound (SMART).
Analyze the KPIs: Analyze the selected KPIs to ensure that they provide the necessary insights into the performance and health of the IoT network. Use data analysis tools to identify trends and patterns in the KPI data and gain insights into areas that may require improvement.
Monitor the KPIs: Implement a system for monitoring the KPIs continuously. This can be achieved using tools such as AWS CloudWatch or other monitoring tools. Set up alerts and notifications to inform relevant personnel when certain KPIs or metrics fall outside predefined thresholds.
Regularly review and adjust KPIs: Regularly review and adjust your KPIs to ensure that they remain relevant and aligned with your monitoring objectives. This involves regularly analyzing KPI data and using the insights gained to refine KPIs as necessary.
Now that we’ve learned how to use KPIs, we can look to understand the different monitoring capabilities that are present both on-premises and on the cloud.
Monitoring capabilities on-premises and on the cloud
Monitoring capabilities are certainly an aspect that is crucial to understanding the limits of how far we can go within what we invest in our solutions. In this section, we will look at how some monitoring capabilities can be taken into consideration in designing our IoT networks.
Automation and machine learning are important aspects of keeping IoT networks running smoothly and securely. With the help of AWS tools and services, organizations can implement these capabilities to identify and predict issues before they happen and take necessary actions automatically to prevent downtime and performance issues.
One useful tool for automation and machine learning on AWS is Amazon SageMaker. This is a service that allows developers and data scientists to build, train, and deploy machine learning models quickly and easily. By analyzing and predicting IoT devices and network behavior, SageMaker can automatically identify potential issues and trigger necessary actions.
AWS IoT Events is another helpful tool for automation and machine learning on AWS. It is a service that allows organizations to detect and respond to events from multiple IoT devices and applications in real time. This service can automate the detection and resolution of common IoT devices and network issues, improving the overall reliability of the system and reducing the need for manual intervention.
AWS also provides a range of data analytics and processing tools, such as AWS Glue, AWS Lambda, and AWS Data Pipeline. These tools can be used to automate the collection, processing, and analysis of IoT data. By identifying patterns and trends in IoT data, these tools can trigger automated responses when specific conditions are met. To implement automation and machine learning capabilities on AWS for IoT networks, organizations should first define their monitoring requirements and establish KPIs to measure system performance. They should also develop machine learning models and algorithms to analyze and predict IoT devices and network behavior and automate the detection and resolution of common issues.
Organizations can use dashboards and visualization tools, such as AWS QuickSight, to provide real-time visibility into system performance and health. These dashboards can be customized to show relevant metrics and KPIs and can be shared with relevant stakeholders to ensure everyone has a comprehensive view of system performance.
By continually reviewing and analyzing monitoring data, organizations can identify opportunities for optimization and enhancement. This process of continuous improvement ensures that their automation and machine learning strategies remain effective over time, keeping their IoT networks reliable and secure.
Exercise on simulating monitoring networks
In this exercise, we will be looking at simulating an IoT network with AWS IoT Core and monitoring it through the tools provided by the service. Here are the steps to follow along:
Log in to the AWS Management Console and navigate to the AWS IoT Core dashboard.
Click on the Test menu and select Simulator to access the AWS IoT Simulator.
Click on Create a new simulation to create a new simulation model.
Enter a name for the simulation model and click on Create to create the model.
Click on Add a device to add a new virtual device to the simulation model.
Enter a name for the device and select a device type from the drop-down list.
Enter the device’s metadata, including the device ID, device attributes, and device shadow state.
Click on Add a behavior to add a behavior to the device. A behavior is a script that simulates the device’s behavior and generates messages that are sent to AWS IoT Core.
Enter the behavior’s name, type, and script code. The script can be written in JavaScript or Python.
Click on Add a topic to add a topic that the device will publish messages to.
Enter the topic name and click on Add to add the topic.
Click on Run to start the simulation.
Monitor the simulation metrics and logs in the Simulation tab. You can view the number of messages sent and received, the message throughput, and the behavior logs for each device.
Add additional devices, behaviors, and topics to simulate a more complex IoT network.
With the knowledge of how to simulate the monitoring of networks, we can forge ahead to understand the metrics that can affect how we configure them.
Early detection of issues: Continuous monitoring of IoT networks enables organizations to detect issues early and resolve them before they turn into major problems. This helps prevent system downtime, reduce maintenance costs, and enhance the overall system performance.
Improved system performance: Real-time monitoring of IoT networks can identify performance bottlenecks and help optimize the system for better performance. This leads to faster response times, improved system reliability, and enhanced user experience.
Better decision-making: IoT monitoring solutions provide real-time data and insights that can inform effective decision-making. Organizations can use the data to make informed decisions that improve operational efficiency, reduce costs, and enhance overall business performance.
Enhanced security: Continuous monitoring of IoT networks helps identify security vulnerabilities and potential threats. This enables an organization to take proactive measures to prevent attacks and protect sensitive data, ensuring the safety and security of the system.
Predictive maintenance: Continuous monitoring of IoT networks can identify patterns and trends that can inform predictive maintenance. This helps an organization identify potential failures before they occur, reducing maintenance costs and increasing the overall lifespan of the system.
Scalability: Continuous monitoring solutions can scale to meet the needs of expanding IoT networks. This enables an organization to handle large volumes of data and maintain a comprehensive view of the system’s performance, even as the network expands.
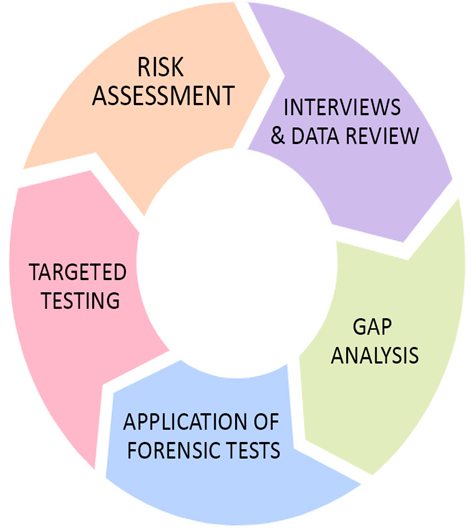
On the other hand, it is important to understand how the monitoring framework is done over AWS and in general. In Figure 9.1, we can see how this framework can be visualized and stepped through for our needs:
Figure 9.1 – IoT network monitoring framework
Here, we have the framework that we will walk through step by step to understand what each step encompasses:
Targeted testing: This step involves testing specific areas of the IoT network to identify potential vulnerabilities or weaknesses. Testing may involve performing a penetration test or using specialized tools to identify vulnerabilities in the network. In a smart home IoT network, targeted testing might involve using a network scanning tool such as Nmap to identify open ports on devices such as smart thermostats or security cameras.
Risk assessment: In this step, the results of the targeted testing are analyzed to identify potential risks and threats to the IoT network. A risk assessment helps to prioritize potential vulnerabilities based on their likelihood and potential impact on the network. After identifying vulnerabilities in the smart home network, a risk assessment could determine that an unpatched security camera poses a high risk due to its accessibility from the internet and the potential for it to be used as a gateway to access other devices on the network.
Interviews and data review: This step involves interviewing key stakeholders and reviewing data from various sources, such as system logs and incident reports. The goal is to gather additional information about potential vulnerabilities and risks to the IoT network. Interviews with the smart home’s residents could reveal that they are unaware of the need to regularly update device firmware. Reviewing system logs might show repeated attempts to access devices from unrecognized IP addresses, indicating potential security threats.
Gap analysis: This step involves comparing the results of the previous steps to the organization’s security policies and procedures. This helps to identify any gaps in the security posture of the IoT network and determine areas where improvements are needed. Comparing the current security measures of the smart home network with industry best practices might reveal gaps such as a lack of regular firmware updates, an absence of strong password policies, or a failure to segment the network to isolate critical devices from one another.
Application of forensic tests: The final step involves conducting forensic tests on the network to gather additional information about potential vulnerabilities and risks. Forensic tests may include analyzing system logs or performing a deep dive into specific areas of the network to identify potential issues. Forensic analysis of the smart home network could involve examining the security camera’s logs to trace back to the origin of unauthorized access attempts. It might also include a deep dive into network traffic to identify any unusual patterns that could indicate a breach or an ongoing attack.
By following these five steps, organizations can ensure that their IoT networks are monitored effectively and continuously, helping to minimize potential risks and threats and ensuring the overall security and efficiency of their networks.
With the increasing number of connected devices and sensors, managing and monitoring IoT networks has become a critical task for organizations. Operating and monitoring IoT networks requires a comprehensive approach that includes continuous operations, setting key performance indicators (KPIs) such as the number of active users on an IoT network or the latency expected, setting/monitoring metrics to measure success, and utilizing monitoring capabilities both on-premises and on the cloud. In this chapter, we will delve into the critical aspects of operating and monitoring IoT networks. We will discuss the importance of continuous operations, exploring the challenges of keeping the system running 24/7 and techniques to ensure maximum uptime. Furthermore, we will explore the essential KPIs that organizations need to measure to ensure the success of their IoT projects, including reliability, scalability, and security.
We will examine the different monitoring capabilities available for IoT networks, including on-premises and cloud-based monitoring tools. Specifically, we will dive into the capabilities of Amazon Web Services (AWS) for monitoring IoT networks. By the end of this chapter, readers will have a comprehensive understanding of the best practices and tools for operating and monitoring IoT networks, enabling them to ensure the success of their IoT projects.
In this chapter, we’re going to cover the following main topics:
Continuous operation of IoT systems
Setting KPIs and the metrics for success
Monitoring capabilities on-premises and on the cloud
Practical – operating and monitoring a joke creator with IoT Greengrass
Technical requirements
This chapter will require you to have the following software ready for the practical. The software requirements may include items that you are already familiar with, as well as new software that you may need to acquire or install.
You will need the following software:
Diagram design software of your choice (e.g., Draw.io)
AWS account
OpenAI subscription (to use ChatGPT)
Arduino IDE
ChatGPT is built on the GPT-4 architecture, presenting a big advancement in the domain of natural language processing (NLP). This model has been trained on vast swathes of data, which allows it to generate coherent and contextually relevant textual outputs, simulating human-like conversation with impressive fluency and depth.
The ChatGPT API emerges as a pivotal bridge between different key pieces of hardware and software. The API allows developers to integrate the capabilities of ChatGPT into their own applications, platforms, or services. The implications for the Internet of Things (IoT) are profound due to this. Picture a world where your smart fridge not only tells you are out of milk but also engages in a nuanced conversation about dairy alternatives, their environmental impacts, and recipes you might try. By melding the ChatGPT API with IoT devices, we can create a seamless, intelligent, and interactive ecosystem that responds and converses with us, enhancing our daily experiences and decision-making processes. In this chapter, we will look at integrating this within one such practical.
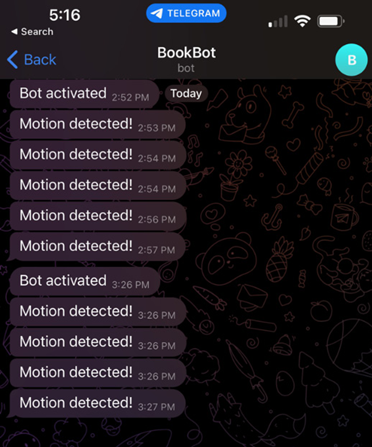
You should see something like the following after you have uploaded your code and start moving in front of the PIR motion sensor. When the bot is first started up, you will get the text Bot activated, and when you make a movement, you will get the text Motion detected!:
Figure 8.10 – Expected output on the Telegram bot
And that’s it; you’ve made your interoperable solution! Now, upload the code to GitHub and see if you can also make these modifications to your hardware/code. Now, for further understanding and practice on the concepts that you have learned through this practical, you can try doing the following.
Can you add an LED bulb to the circuit to also react when you receive a movement on the PIR motion sensor?
Can you replace the motion sensor with a DHT11 sensor to send messages to Telegram when the temperature rises above 30°C?
Feel free to use the documentation from the Super Starter Kit to also help you navigate the use cases of each sensor and how to properly use them.
Summary
In this chapter, we learned about what interoperability is, why it is important for IoT, and how we can architect solutions for it while navigating through the challenges that are being posed. We then looked further into how it can be beneficial with our practical in building a Telegram chatbot that alerts you to motion detection based on your ESP32, showing how interoperability is imperative to functioning solutions.
Through the discussions and practical exercises in this chapter, readers have gained a comprehensive understanding of interoperability and its significance in IoT. This understanding forms a foundation for creating robust, scalable, and adaptable IoT solutions. Additionally, by exploring how to architect solutions and navigate challenges, readers have acquired valuable insights and strategies that can be applied to their own projects. This equips readers with a broader toolkit to address the complex demands of IoT environments, making them better prepared to contribute to projects in this domain, or even lead initiatives that require a deep understanding of interoperability.
In the next chapter, we will look at operating and monitoring IoT networks.
Further reading
For more information about what was covered in this chapter, please refer to the following links:
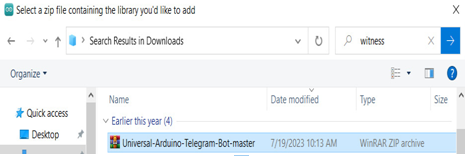
Interaction with the Telegram bot will be facilitated using the Universal Arduino Telegram Bot Library, a tool created by Brian Lough that simplifies access to the Telegram Bot API. We will ensure that our Arduino IDE has these libraries and procure them if not. Proceeding from here, we can follow the following steps:
We then need to include the library. We need to navigate to Sketch > Include Library > Add. Zip the library and add the library:
Figure 8.7 – Pop-up window to add in the Universal Arduino Telegram Bot library
Important note
You should not be installing the library with the Arduino Library Manager, as a deprecated version may be installed instead.
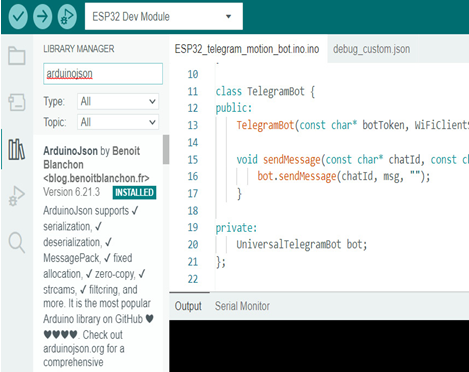
We then must install the ArduinoJson library. To do this, we navigate to Sketch > Include Library > Manage Libraries.
We then search for arduinojson and install its latest version:
Figure 8.8 – Adding in the ArduinoJson library
With the libraries installed, we can now prepare the hardware.
Hardware setup
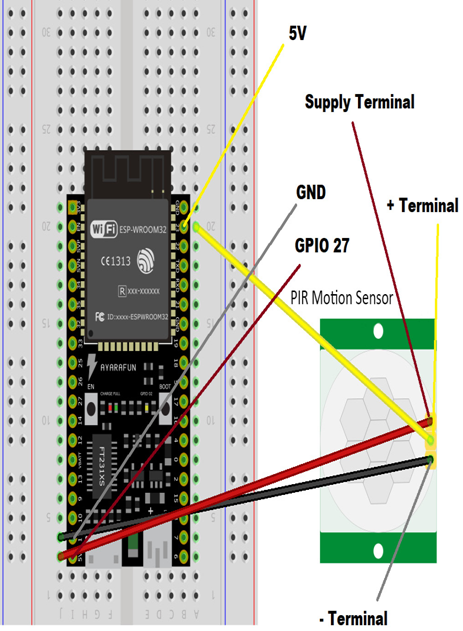
We will connect the ESP32 to the PIR motion sensor according to the following diagram. It is a motion sensor that detects movement by sensing changes in infrared radiation emitted by warm objects, such as humans or animals, in its field of view:
Figure 8.9 – Circuit diagram for PIR motion sensor
On the PIR to the ESP32, we will connect the negative terminal to GND, the positive terminal to 5V, and the supply terminal to GPIO 27.
Coding it up
We are now ready to start coding up the necessary code to run the program on our Arduino IDE.
We first declare the necessary libraries for the program. The WiFi.h library is used to connect to the internet over Wi-Fi. The WiFiClientSecure.h library establishes a secure client connection to ensure the data communication is encrypted. The UniversalTelegramBot.h library is for controlling the bot on Telegram, and the ArduinoJson.h library handles the JSON data format used by the Telegram bot: #include <ArduinoJson.h> #include <UniversalTelegramBot.h> #include <WiFiClientSecure.h> #include <WiFi.h>
We then create a struct to hold our network credentials (SSID and password), and you need to replace the “YOUR_SSID_HERE” and “YOUR_PASSWORD_HERE” placeholder values with your own values. Afterward, a TelegramBot class is defined that encapsulates the functionality of the UniversalTelegramBot library, simplifying our use of it later in the code. After this, we instantiate a NetworkCredentials object with bot_token and chat_id values that you need to replace with the personalized token you received for your bot and the user ID you received for your telegram account respectively, wifi_client as an instance of WiFiClientSecure to handle secure connections, and telegramBot as an instance of our TelegramBot class using the bot token and the secure client: typedef struct { const char* network_id = “YOUR_SSID_HERE”; const char* network_pass = “YOUR_PASSWORD_HERE”; } NetworkCredentials; class TelegramBot { public: TelegramBot(const char* botToken, WiFiClientSecure& client) : bot(botToken, client) {} void sendMessage(const char* chatId, const char* msg) { bot.sendMessage(chatId, msg, “”);} private: UniversalTelegramBot bot;}; NetworkCredentials networkCredentials; const char* bot_token = “6344540752:AAHN_xoPfRipHbAf2d5cbceWLnYvxd2uRiI”; const char* chat_id = “6394755694”; WiFiClientSecure wifi_client; TelegramBot telegramBot(bot_token, wifi_client);
Following that, we set up the PIR sensor pin and a Boolean flag to track whether motion is detected. The detectMotion function will be called whenever the sensor pin detects a rising voltage (that is, motion), setting movementDetected to true: constexpr int PIR_SENSOR_PIN = 27; volatile bool movementDetected = false; void IRAM_ATTR detectMotion() { movementDetected = true;}
We then need to create a connectWiFi function that sets the ESP32 to operate in Station (STA) mode and then attempts to connect it to the Wi-Fi network using the credentials we provided earlier. It also sets the certificate root on the secure client. It then waits until the ESP32 is connected before continuing the program: void connectWiFi() { WiFi.mode(WIFI_STA); WiFi.begin(networkCredentials.network_id, networkCredentials.network_pass); wifi_client.setCACert(TELEGRAM_CERTIFICATE_ROOT); while (WiFi.status() != WL_CONNECTED) { delay(500);}}
Finally, we create setup() and loop() functions. The setup() function initializes serial communication, sets the PIR sensor pin as an input with a pull-up resistor, and attaches an interrupt to it. It then connects to the Wi-Fi and sends a message indicating that the bot is active. The loop() function is the main loop of the program, which constantly checks if motion has been detected. If so, it sends a message and resets the flag: void setup() { Serial.begin(115200); pinMode(PIR_SENSOR_PIN, INPUT_PULLUP); attachInterrupt(digitalPinToInterrupt(PIR_SENSOR_PIN), detectMotion, RISING); connectWiFi(); telegramBot.sendMessage(chat_id, “Bot activated”);} void loop() { if (movementDetected) { telegramBot.sendMessage(chat_id, “Motion detected!”); movementDetected = false;}}
As per usual, verify the code to ensure that you have entered everything correctly. Remember that there are four fields you must personally modify with your own information. If everything is done correctly, you should see the upload be successfully completed and your Telegram bot start churning messages after you have clicked Start on it.
And with that, we are ready to test our implementation.