Practical – smart home insights with AWS IoT Analytics – Working with Data and Analytics-2
Click on the target S3 bucket on the canvas and select the format as Parquet. Specify the new Amazon S3 bucket you created (for example, s3://your_bucket_name).
Go to the Job details tab and specify the IAM role you have been using so far. Leave everything else as it is. Rename the script filename to anything you want, as long as it ends with .py (for example, test.py):
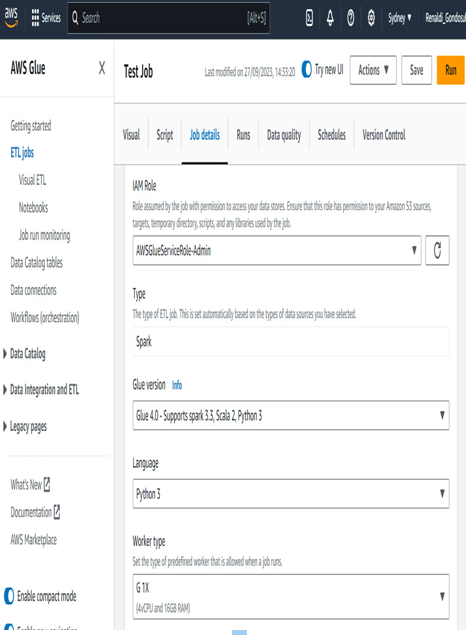
Figure 10.3 – Configuring job details for the Glue job
Click Save, and afterward, click Run.
With that, we have appropriately transformed the data as needed.
Use Amazon Athena to query the transformed data.
We can now look at leveraging Amazon Athena to query the data that we have transformed:
- Navigate to the Amazon Athena service.
- On the sidebar, click on Query editor.
- There should be a prompt asking you to select an output location for your queries. Specify an S3 bucket or a folder within a bucket to do so.
- In the Athena dashboard, select AWSDataCatalog as the data source and SmartHomeData database (or your predefined values for them).
- Run the following query by clicking Run:
Select * from mychannelbucket
6. You should get the full table that you created before. Now, use SQL queries to answer the following questions:
- What is the average temperature, humidity, and light intensity for each day of the month?
- What is the average temperature, humidity, and light intensity for each hour of the day?
- What is the average temperature, humidity, and light intensity for each day of the week?
- What is the correlation between temperature and humidity and between temperature and light intensity?
- View the query results and save the query results to a new S3 bucket.
In this practical exercise, we explored IoT data analytics using AWS services such as S3, Glue, and Athena. We loaded a dataset of IoT sensor readings into an S3 bucket, used Glue to transform the data and create a new table with additional columns, used Athena to query the transformed data and generate insights, and used QuickSight to visualize the insights and create a dashboard. Based on the insights generated, we provided recommendations for improving the smart home experience.
We will now move on to industrial data analytics.