A case study for data analytics – Working with Data and Analytics
Now that we have seen use cases and have learned about how we can evaluate IoT deployments that leverage data analytics services on AWS, let’s take a look at how one industrial environment can utilize the AWS environment to perform data analytics workloads and the workflow behind it. We can see this case represented in Figure 10.4:
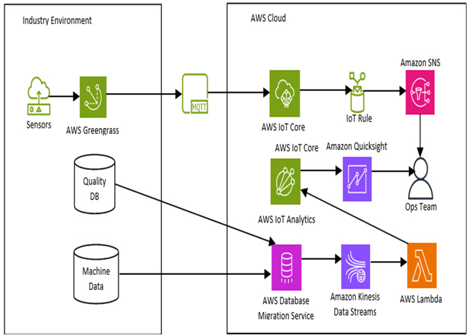
Figure 10.4 – AWS data analysis within an industrial environment
In this workflow, we can see that the industrial environment is pushing data onto AWS Greengrass, which in turn uses the IoT MQTT protocol to deliver data to AWS IoT Core. It will then in turn put through data to AWS IoT Analytics to be further visualized via QuickSight. On the other hand, if an IoT rule is triggered, it will instead feed the data to Amazon SNS, where the operations team will be notified through an alert. Additionally, data can also be fed in by moving the on-premises database onto the cloud with Database Migration Service (DMS), which is a service used for migrating databases onto AWS. It can then be ingested using Amazon Kinesis Data Streams and processed using AWS Lambda, where it then will be fed into AWS IoT Analytics.
Now that we’ve become more familiar with these workflows for data analytics, let’s get on to our practical.
Practical – creating a data pipeline for end-to-end data ingestion and analysis
In this practical, we will look to create a data pipeline based on the AWS console. This will follow the architecture shown in the following diagram:
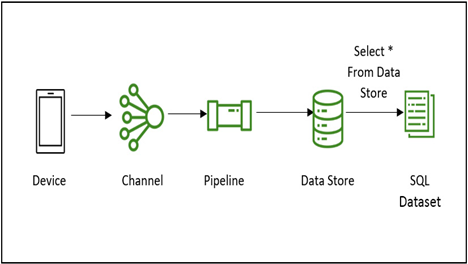
Figure 10.5 – Data pipeline workflow for data ingestion
We will have a device send data to a channel. The channel will receive the data and send it through the pipeline, which will pipe the data through to the data store. From the data store, we can then make SQL queries to create a dataset from which we will read the data.
We can now go ahead and start off by creating a channel.